
.svg)

At the denser wall, average picking time per order fell from 40 seconds to 13, and orders that ran clean from start to finish rose from 18% to 97%. This is the companion to our Direct Pack + Pack-to-Light case study, from the same research.

.svg)
ShipHero tested Pack-to-Light at two production card walls, each packing 1,170 to 1,210 pick locations into 57 to 78 sq ft, and coded 184 orders on video. Picking time fell 60% to 67%, from 40 seconds to 13 at the denser wall, and reaching for the wrong card went from 131 times without lights to none observed with them. At the wall that packs on site, the full order cycle fell from about 57 to 38 seconds, an estimated 50% more orders per hour. These figures belong to card walls only. Standard Direct Pack stations see a smaller time saving, and the reason why is what makes this a separate case study.
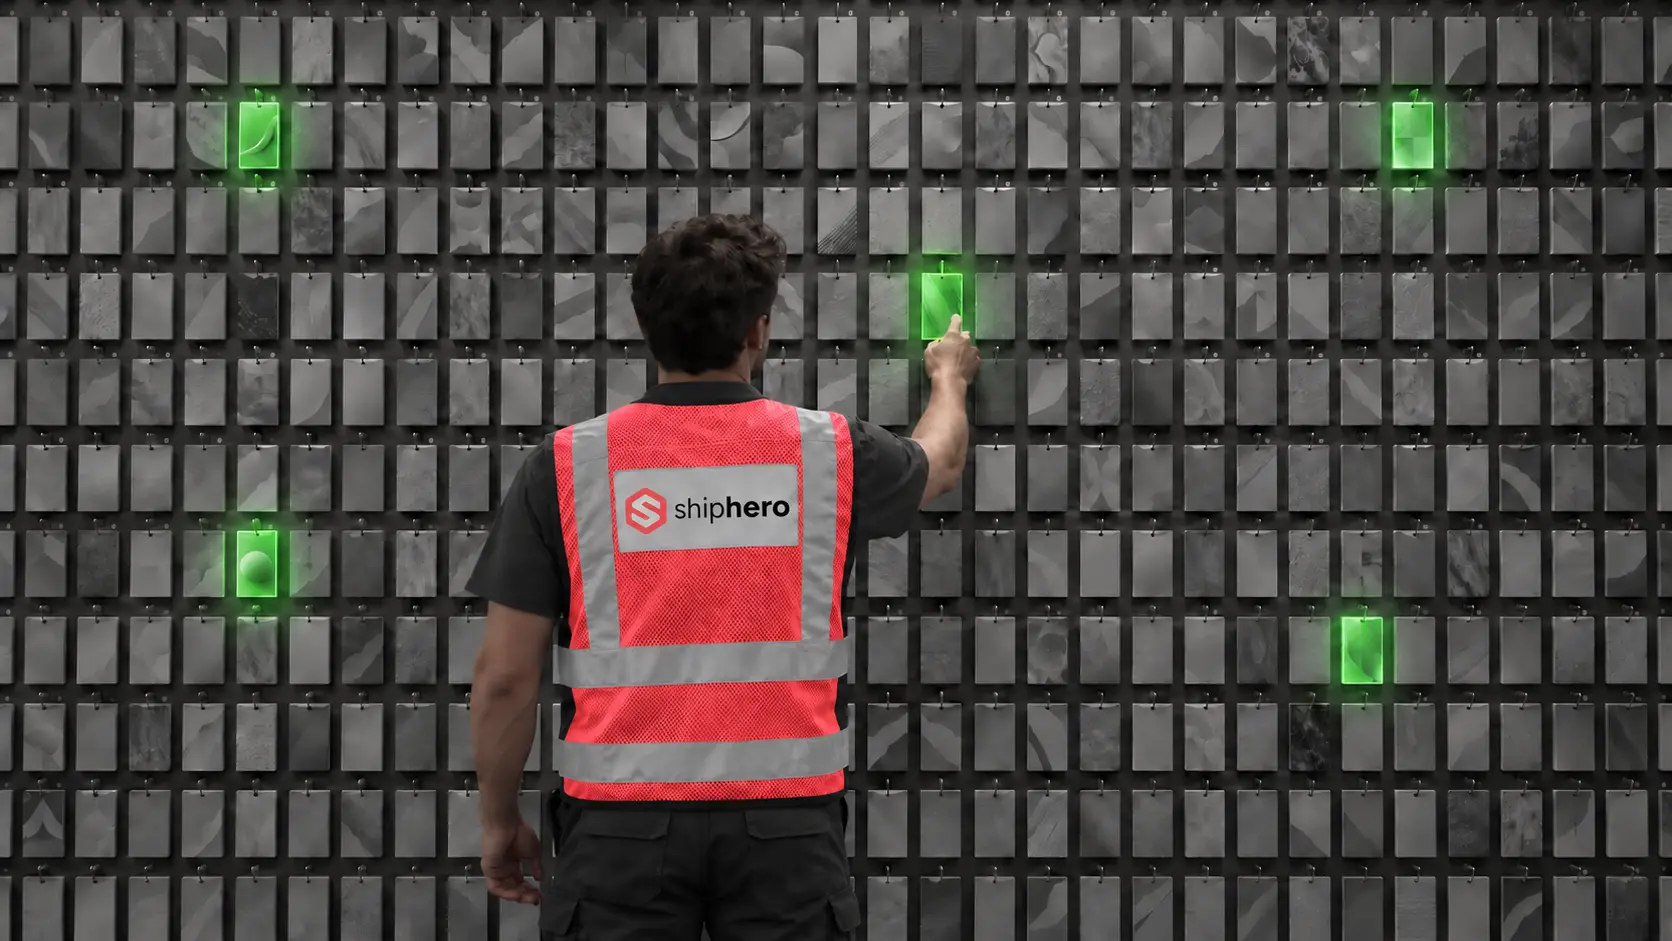
A new order opens and asks for three cards. They are somewhere on a wall of 1,200 slots, all within a few steps. There is almost nothing to walk to and far too much to memorize, so the picker's whole job is finding the right card, and finding is exactly what ShipHero Pack-to-Light takes away.
That is why we went back to the most extreme layout we could find. The result is the largest picking time saving in the whole Pack-to-Light study, and the sharpest drop in errors.
This analysis is part of the same research as the Direct Pack + Pack-to-Light Case Study: Picking Errors Dropped by 93%.
That first case study measured Pack-to-Light at standard Direct Pack stations, which run at around one pick location per square foot. The card walls here were tested with the same method, the same lights and the same lights-on against lights-off comparison, but they sit at 16 and 21 pick locations per square foot, more than ten times denser.
At that density, the problem changes from walking to searching, and the numbers change with it. That’s why we are publishing the results as two separate analyses that link to each other, and we strongly encourage our readers to explore both.
The figures below apply to card walls only. Please note that the standard-station results should not be used to estimate a card wall.
The protocol is the one used at the standard stations. Every comparison is the same picker, at the same station, working real production orders with the lights on versus off, in alternating blocks so that warm-up and fatigue affect both conditions equally. The clock starts the moment the order is on screen and the picker is free to act on it. Packing is left out of the picking comparison. As before, one order line corresponds to one location visited.
Two card walls at Company 3 (*) were tested, each worked by its own picker, both veterans who run their wall every day. In total, 184 orders were coded on video, 94 without lights and 90 with them. Order mix and packing times come from the system's records of production orders at each station, and average picking times are weighted by each wall's real order mix.
Picking time fell further than anywhere else in the program:
The saving also climbed with order size:
Underneath sits the same pattern as at the standard stations, pushed to an extreme. Without lights, each additional location cost 10 to 12.5 seconds. With lights, it took about 3 seconds, in line with the 3 to 4 seconds seen at every standard station.
At the standard stations, packing the bins tighter made no difference to picking times. Walking distance and station familiarity did. Card walls work the other way. The denser wall saved more per location than the less dense one, so here the density itself drives the saving.
The reason is where the time goes. At a standard station the bottleneck is walking, and denser bins do not change that. However, at a card wall the bottleneck is search, and every extra card in the same space makes an unguided hunt harder.
The denser the wall, the more the lights are worth.
Experience does not protect a picker here either. In the first case study, a veteran at a compact 65-location station gained almost nothing per line, because they could hold the whole station in memory. At 160 locations that stopped working. At 1,200, the question does not even come up.
The error results were the sharpest in the study. Across 94 orders without lights and 90 with them:
Added together, every search event and error came to 479 across the lights-off orders, about 5 per order, against 5 across all lights-on orders. That is roughly 90 times fewer. These are observed counts across the orders coded, not a guaranteed zero.
Picking is what the lights change. Packing takes the same time with or without them.
The larger wall packs on site. Its packing averages about 26 seconds per order, measured from production orders from the system. Added to the picking time, the full order cycle falls from about 57 seconds to 38, an estimated 50% more orders per hour from the same picker.
The denser wall picks into totes that are packed at another station, so its gain is on the picking side only: about three times as many orders picked per hour.
Packing time varies by station and by client, so the capacity gain at any other station depends on its own packing.
Two walls, two pickers and 184 orders coded on video, and the findings point the same way:
The reason this matters is not only the seconds. A wall that cuts picking time by 60% to 67% without a new hire and without a card being moved is capacity bought with hardware instead of headcount, and it arrives without a ramp-up period. The error side compounds that. A wrong card that reaches a customer costs a replacement shipment, a support conversation and some of the customer’s confidence, all of it downstream of a mistake that took two seconds to make.
Same lights, a different problem, and the one where they pay the most.
If your 3PL or brand runs pack stations and you want to know what the lights could do at yours, reach out to the ShipHero team. We’ll talk through your layout and order profile and help you work out whether Pack-to-Light is the right fit.
(*) A note on names: the company whose walls were tested is referred to here as Company 3. Its operation was the real-world environment for the measurements, not a research partnership, so we describe its stations without identifying it.
.webp)
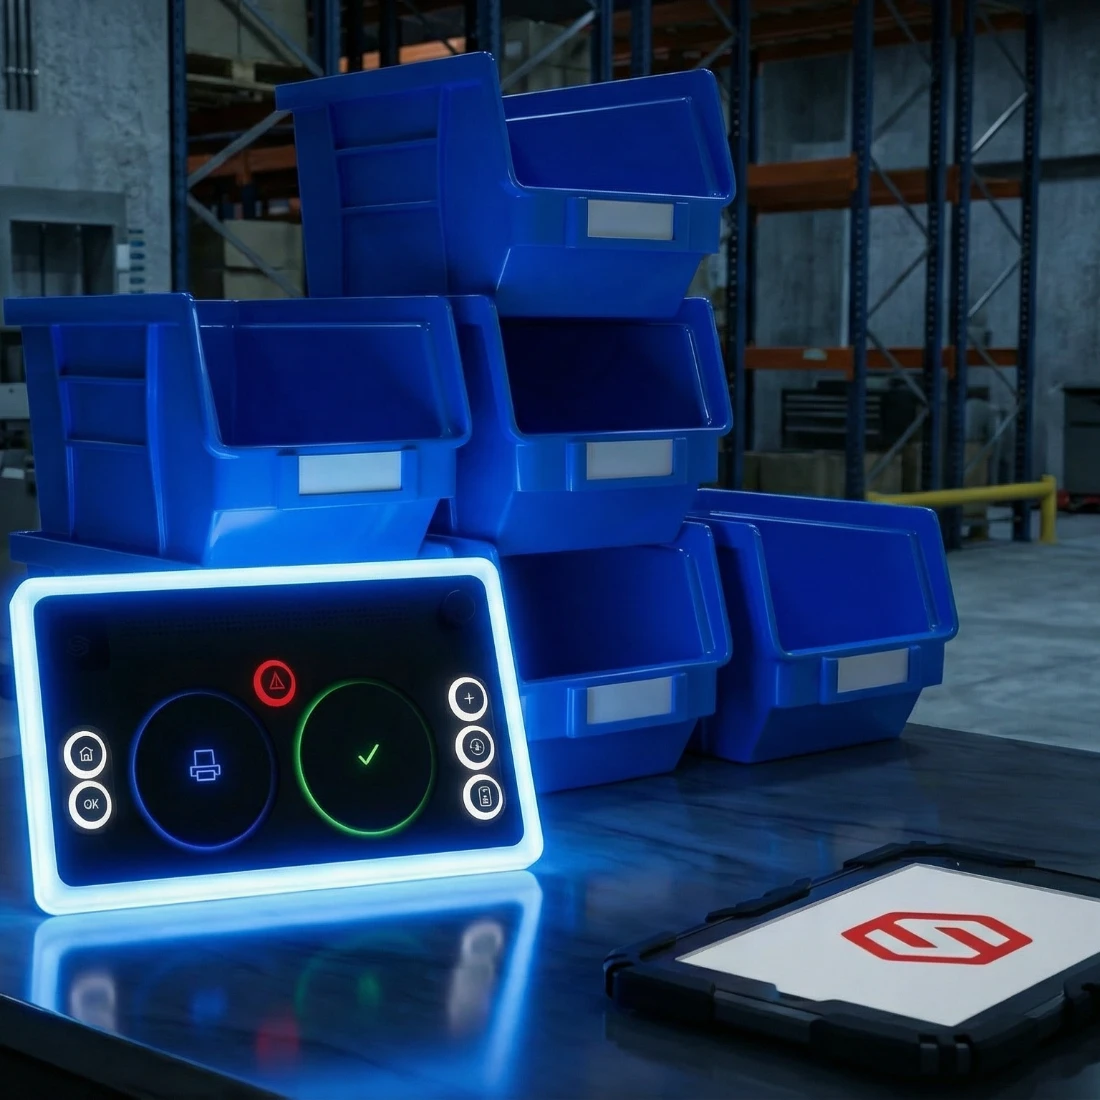
Why Keyboards Are Killing Your Pack Line (And What to Do About It). Stop losing throughput to keyboards and mice. ShipHero's Tap-to-Pack replaces screen navigation with an 8-button industrial controller built for 99.9% packing accuracy.
.svg)
On September 1, 2026, Descartes Systems Group announced its acquisition of Extensiv for approximately $120 million. What was announced, what usually follows deals like this, and the questions Extensiv customers should put to their vendor before renewal.



.svg)



.webp)